Introduction
Table of Content
Power BI is a robust tool for data analysis and visualization, allowing users to create interactive reports and dashboards. One of its powerful features is the ability to create pivot tables for dynamic data summarization. However, Power BI doesn’t natively support placing measures in the rows of a pivot table—a common need when working with data. This guide will walk you through a simple workaround to achieve this, using a disconnected table, measures, and relationships to ensure your data is accurately filtered and displayed.
Why This Matters: Imagine you’re analyzing match data and want to categorize rows by whether they match or not—something that typically requires placing a measure in a row. This guide will help you do just that, providing you with more control over your data presentation.
Objective
The goal of this guide is to place the Lvl1_Match measure into the row of a pivot table in Power BI. By creating a disconnected table, defining measures, and establishing relationships, you can achieve a measure-driven approach to filtering your pivot table rows.
Step 1: Create a Disconnected Table
The first step is to create a disconnected table. This table isn’t directly related to your main data model but will be used to create slicers or filters that affect your visualizations based on selected values.
- Go to the Modeling Tab
In Power BI Desktop, navigate to the Modeling tab. This tab allows you to create and manage tables, columns, measures, and relationships in your data model.
- Create a New Table
To create a new table, click on New Table in the Modeling tab. This will open a DAX formula editor where you can define the structure and contents of the new table.
- Define the Disconnected Table
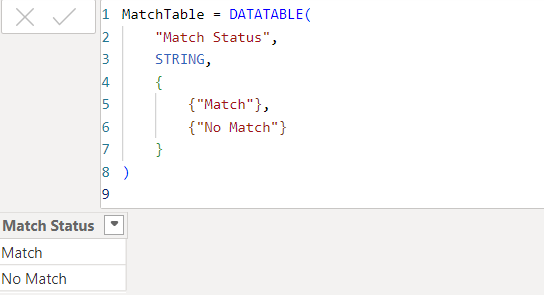
We will use the following DAX formula to create a table called MatchTable, which contains two rows: one for “Match” and one for “No Match”.
Use the following DAX formula to create a table with “Match” and “No Match” values:
DAX:
MatchTable = DATATABLE(
    "Match Status",
    STRING,
    {
        {"Match"},
        {"No Match"}
    }
)
- This DAX formula creates a table with a single column, Match Status, and two rows with the values “Match” and “No Match”. This table will be used later to filter the data based on user selections.
Step 2: Create a Measure for the Lvl1_Match
Next, create a measure that captures the slicer selection from MatchTable. This measure will help filter your data according to whether “Match” or “No Match” is selected.
- Create a New Measure
In the Modeling tab, click on New Measure. This will open the DAX formula editor where you can define the measure.
- Define the Measure
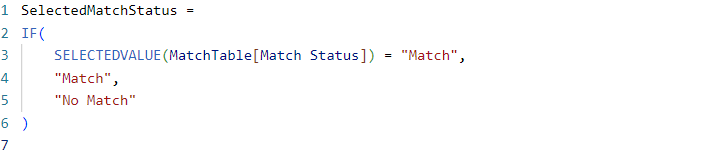
We will use the following DAX code to create a measure called SelectedMatchStatus:
Write the following DAX code to create a measure that captures the slicer selection:
DAX:
SelectedMatchStatus = IF(
    SELECTEDVALUE(MatchTable[Match Status]) = "Match",
    "Match",
    "No Match"
)
- The SelectedMatchStatus measure returns “Match” if the user selects “Match” in the slicer, and “No Match” if “No Match” is selected. This measure dynamically reflects the user’s selection and will be used to filter the data.
Step 3: Apply the Measure to Filter Your Data
With the SelectedMatchStatus measure in place, we can now modify or create a new measure that filters the data based on this selection. This step is crucial because it ensures that the data displayed in the pivot table is filtered according to the user’s choice.
Modify the Existing Measure
If you already have an existing measure for Lvl1_Match, you can modify it to incorporate the filtering logic. Alternatively, you can create a new measure specifically for this purpose. Below is an example of a new measure:
Example of a new measure:
DAX:
FilteredLVL1_Match =
IF(
    [LVL1_Match] = [SelectedMatchStatus],
    1,
    0
)
- The FilteredLVL1_Match measure returns 1 if the Lvl1_Match value aligns with the selected status from the MatchTable, and 0 otherwise. This measure is essential for filtering the rows in the pivot table based on the slicer selection.
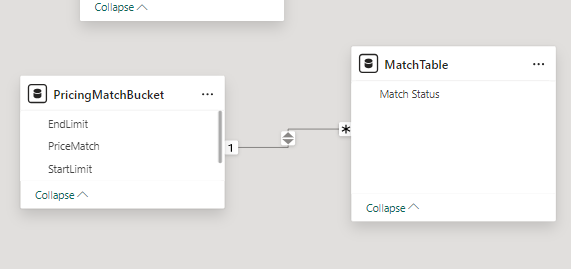
Step 4: Create a Relationship Between the Disconnected Table and the Relevant Table
To ensure that the filtering works correctly across your data model, you need to establish a relationship between the disconnected table (MatchTable) and the table containing the data you want to filter.
- Establish a Relationship
In the Modeling tab, select Manage Relationships. This option allows you to create and manage relationships between different tables in your data model.
- Create the Relationship
Create a relationship between the MatchTable and the table containing your data (e.g., Pricing Market Bucket). The relationship should be based on the relevant fields allowing filtering across these tables. It’s important to note that the relationship does not need to be active, as we will be controlling the filtering through measures.
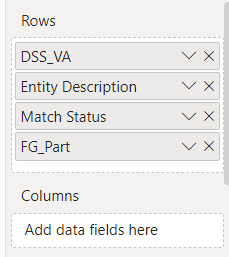
Step 5: Place the Disconnected Table Field in the Row of the Pivot Table
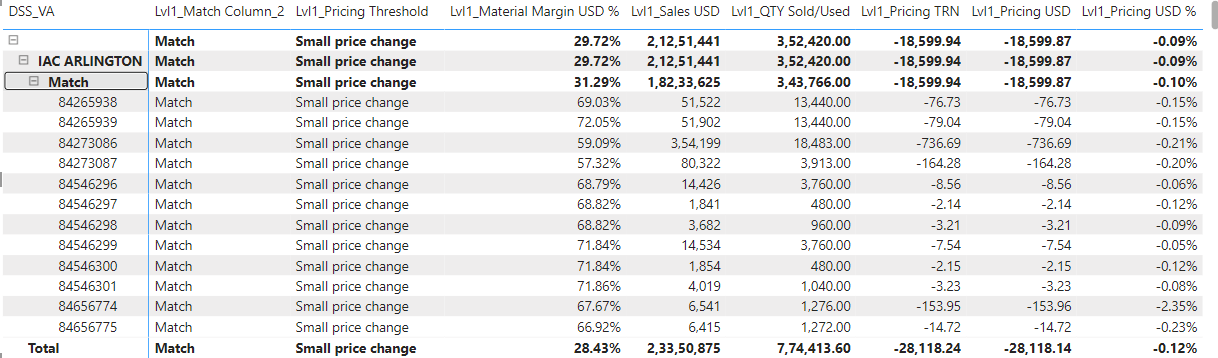
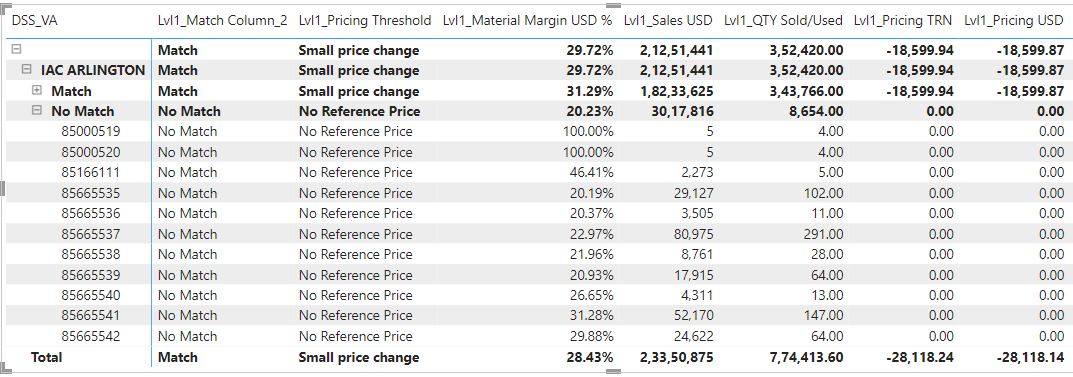
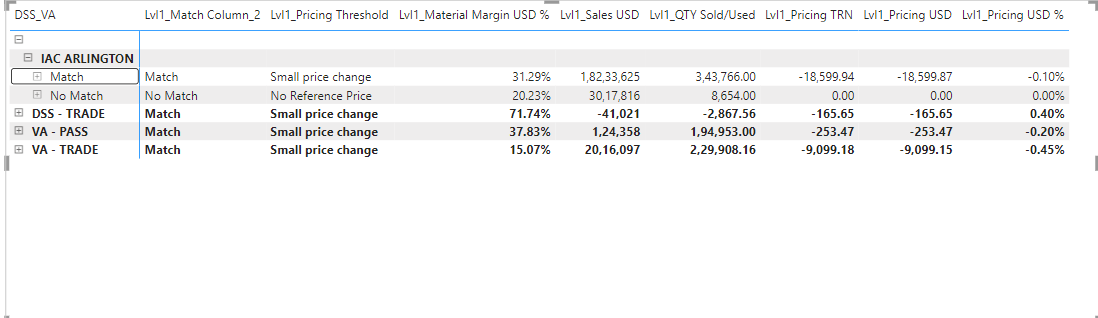
Now that the disconnected table and measures are set up, you can place the MatchTable[Match Status] field into the row area of your pivot table. This step allows the pivot table to be categorized based on the values from the MatchTable.
- Add the Field to the Pivot Table Row
In the Report view, drag the MatchTable[Match Status] field to the row area of your pivot table. This will create row categories based on the “Match” and “No Match” values. These categories will be dynamically filtered based on the user’s selection in the slicer.
Step 6: Use the FilteredLVL1_Match Measure to Filter Your Visuals
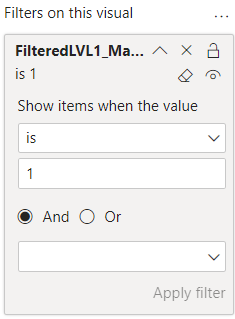
The final step is to apply the FilteredLVL1_Match measure to the pivot table or other visuals in your report. This measure will ensure that only the rows where FilteredLVL1_Match equals 1 are displayed.
Apply the Measure to Visuals
In your pivot table or other visuals, use the FilteredLVL1_Match measure as a filter. Set the filter condition to show only rows where FilteredLVL1_Match equals 1. This ensures that the visuals only display data that matches the user’s selection in the slicer.
Conclusion
By following these steps, you can successfully place a measure in the row of a pivot table in Power BI. This process involves creating a disconnected table, defining measures, and establishing relationships that facilitate dynamic filtering based on user selections. The use of measures like SelectedMatchStatus and FilteredLVL1_Match allows for more flexible and interactive data analysis, giving you greater control over how data is presented in your reports.
Outcome
Ready to enhance your Power BI capabilities?
Now that you’ve mastered the technique of placing a measure in a pivot table row in Power BI, it’s time to take your data analysis to the next level. At Rao IT, we specialize in helping businesses unlock the full potential of their data with advanced Power BI solutions and customized reports. Whether you’re looking to optimize your existing reports or need a comprehensive data strategy, our team of experts is here to help.
- Explore More: Visit our blog for more tips and tricks on Power BI and other data tools.
- Get in Touch: If you have any questions or need personalized assistance, don’t hesitate to reach out to our team. We’re just a click away!
- Start a Project: Interested in working with us? Let’s discuss how we can help you achieve your data goals. Contact Us today to schedule a consultation.
Leave a Reply